

Business Insights Data Architect
How I’m using Copilot in Fabric: Data Factory, Data Science – Spark Notebooks, Power BI Desktop – DAX Query View, and Visuals Creation.
As a BI Engineer/Data Analyst, I often work with different tools and platforms to collect, process, analyze, and visualize data. However, sometimes I face challenges such as writing complex code, creating effective measures, or designing engaging visuals. That’s why I was excited to try Microsoft Copilot, a new AI-powered assistant that helps me write code faster and create better content more quickly in Fabric. In this blog post, I will share my experience using Copilot with four tools: Data Factory, Data Science – Spark Notebooks and DAX Query View, and Visuals Creation in Power BI Desktop. I will also highlight the benefits and features of Copilot that impressed me the most.
Data Factory is a tool in Fabric that allows me to create data pipelines and orchestrate data movement and transformation. One of the tasks that I often do in Data Factory is clean and transform data, such as removing duplicate and bad rows of data, using the first row as column headers, and removing or adding columns. Copilot was very helpful in this task, as it suggested code snippets and expressions that could be used to perform these operations. You could ask Copilot to do things like create new queries, add steps to existing queries, or describe an existing query or step. For example, below is a screenshot of asking Copilot in Data Factory to remove duplicate data rows based off the Customer field. I am not sure that this could be made any easier.

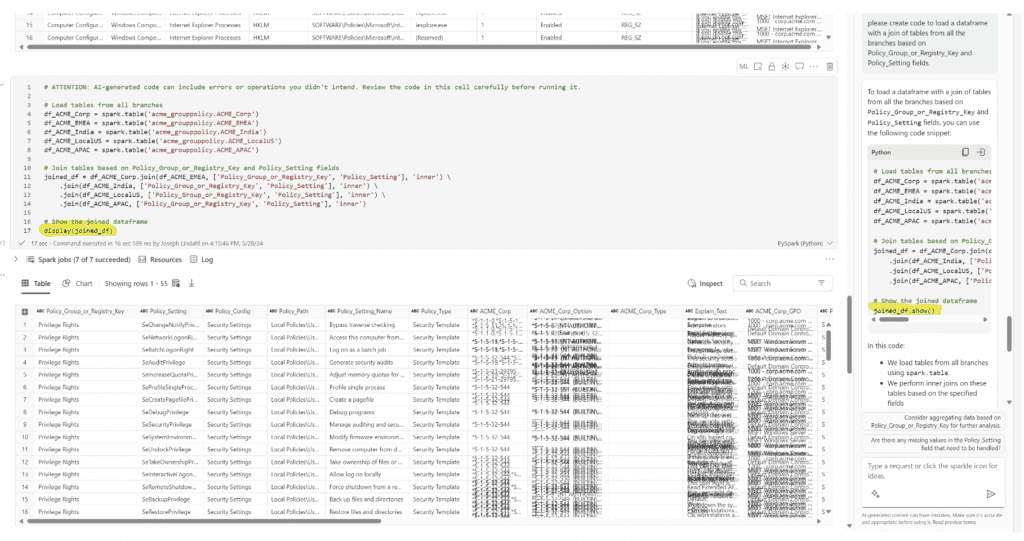
Spark notebooks are one of the Data Science tools of Fabric that allows me to write and run code in an interactive environment and use Spark to process large-scale data. I was not remarkably familiar with Spark or Notebooks as I have not traditionally held a role as a Data Scientist. However, Microsoft continues to flatten the learning curve, as Copilot was a major help in this tool. Copilot suggested code snippets and comments that I could use to write Spark SQL queries, create data frames, perform aggregations, join tables, and inspect and visualize data. This helped me get up and running quickly as I am familiar with writing traditional SQL queries. For example, I asked Copilot the command below, and what it came back with was almost perfect—the problem was me not providing enough context, not Copilot. I should also mention this is on some gnarly group policy text data from a bunch of spreadsheets… we can’t make it too easy!
PROMPT: “Please create code to load a data frame with a join of tables from all the branches based on Policy_Group_or_Registry_Key and Policy Setting fields.” The results were amazing! With a couple button clicks I can easily add this code cell and run it, then further inspect from there or chart my data with ease (screenshot below).
Power BI Desktop – DAX Query View
DAX Query View is another tool in Fabric, but found in Power BI Desktop; that allows me to write and run DAX queries, and create measures and calculations based on my data model. DAX is a powerful and expressive language, but it can also be complex and tricky to master. Copilot was amazing in this tool, as it helped me write and test DAX queries, and create measures, upon measures, upon measures in moments!
For example, the default out-of-the-box “suggest measures” is actually the following prompt: “Define and evaluate measures not in my model and add a comment that explains what each measure does.” Either run this as-is or refine it to your liking. Copilot will typically come back with around four new measures for you to examine/analyze and add to your model if you desire. Simply click the “Keep Query” button, which will then add a nifty “Update Model: Add New Measure” hyperlink above each of the suggested measures. Now just decide which ones you want to keep, then rinse and repeat. I can now easily run and test these DAX queries in the query view and see the results in a table all in one place. Having written DAX measures for several years as a professional, I can’t put into words the amount of time and effort this single Copilot tool saves alone!

Visuals Creation
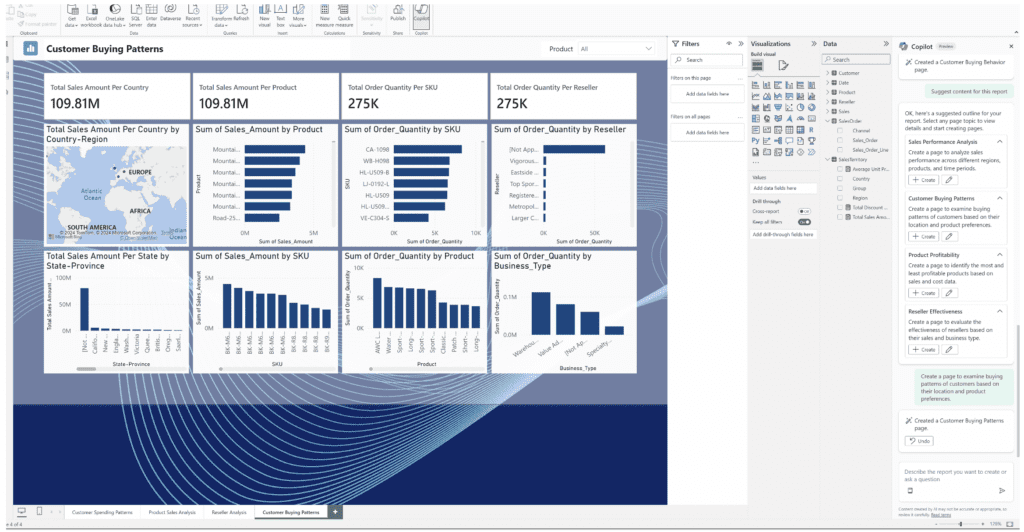
Visuals Creation is a tool that allows me to create and design visuals and reports in Power BI Desktop and share them with others. Visuals are a great way to communicate and present data, but they can also be challenging to create and format, especially when starting from scratch. Copilot was very helpful in this tool, as it helped me create and suggest content for my report and customize and enhance my visuals. For example, I could simply ask Copilot to “Suggest content for this report” and it would analyze my data and then come back with four different options that I could easily add to my report with a single button click!
For the best performance I found these few tips extremely helpful:
After learning these tips, I was able to hand the reins over to Copilot and let it go to work creating rich and robust visuals for my report in a matter of seconds.
In this blog post, I shared my experience using Microsoft Copilot in Fabric, and how it helped me with various tools such as Data Factory, Data Science – Spark Notebooks, DAX Query View, and Visuals Creation in Power BI Desktop. Copilot is a great assistant that helped me write better code and create better content, along with helping me learn and improve my skills. Copilot was easy to use, fast, and accurate, and it offered me suggestions and explanations that I could work with. Copilot greatly boosted my productivity, confidence, and satisfaction in my work, and I highly recommend it to anyone who works in Business Intelligence. Whether it be ingesting and transforming data, performing data discovery, analysis, or modeling, creating measures or even creating end-user reports; Copilot in Fabric is an amazing tool and a real game changer!
Our experts are ready to help you boost your productivity using Microsoft tools. Interested in signing up for a Microsoft Fabric Educational Workshop? Click Here to Learn More, or complete the form below.
Complete this form to schedule time with one of our experts.