Microsoft Defender for Endpoint Detection and Response Management
Microsoft Defender for Endpoints Endpoint Detection and Response (EDR) is the first module of the platform that you will get immediate benefits from. By merely onboarding your devices to MDE, you light up all the capabilities within EDR. EDR capabilities provide actionable intel on threats that are prioritized by impact. You can gain visibility to the full scope of a breach and take necessary actions to stop the attack. Capabilities for all onboarded devices include dashboard insights, an alerting system on any malicious activity occurring on devices, intelligent processing of aggregated alerts into a single pane of glass, and a full in-depth management and response tasks for each device.
EDR can also be utilized even if utilizing a 3rd party anti-virus solution if Microsoft Defender is running in passive mode.
EDR Components
There are four primary components to MDE EDR. Each are listed below with complete details in the following sections:
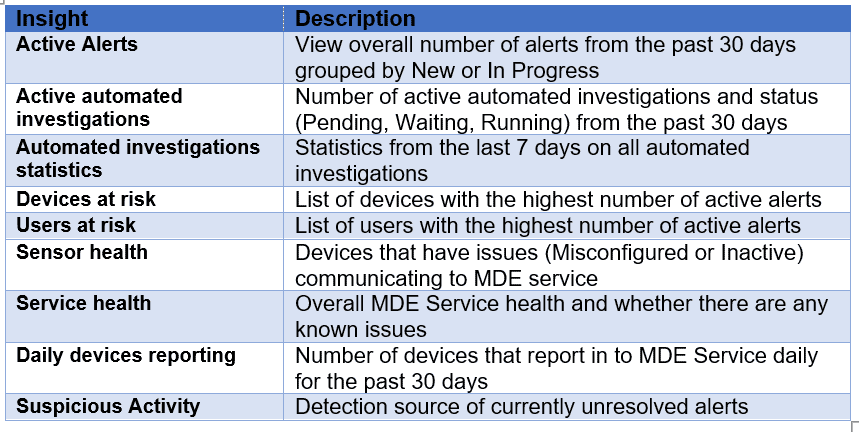
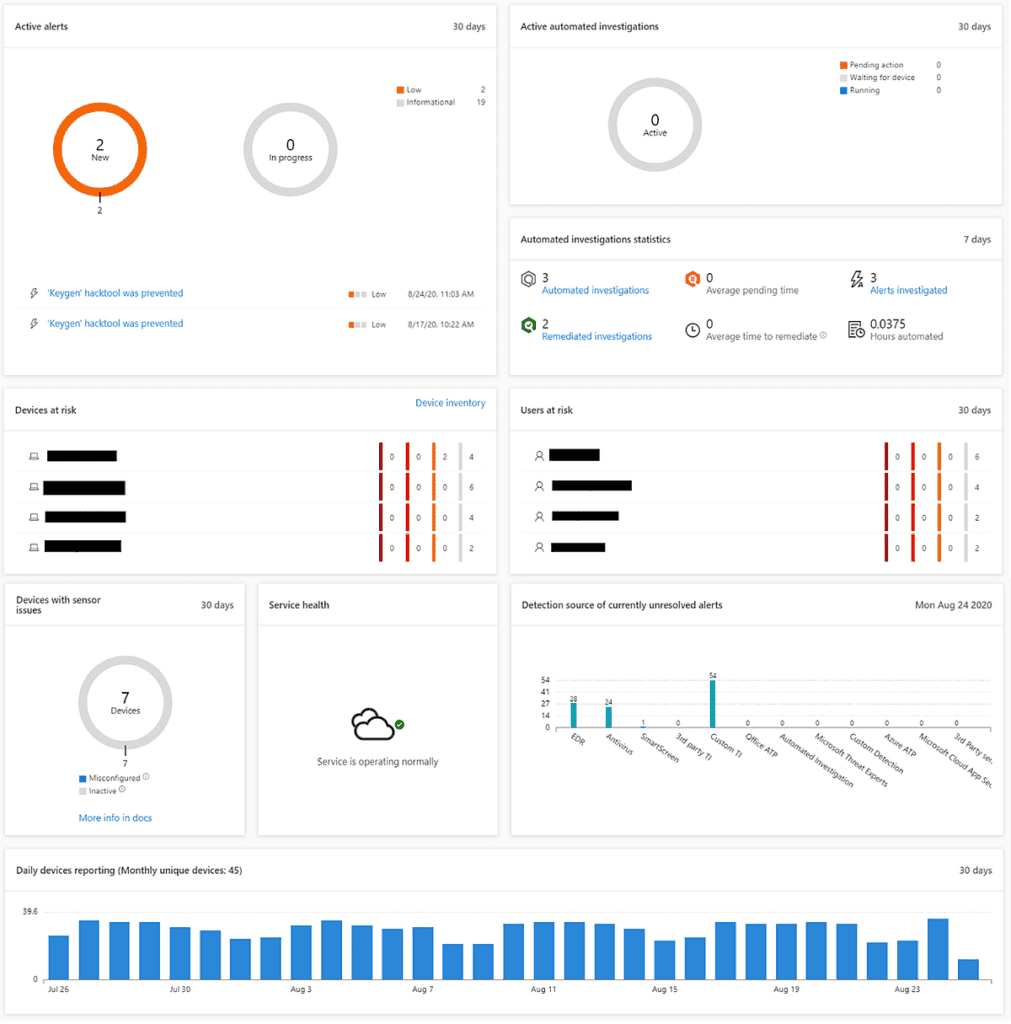
The security operation dashboard provides highlights of the overall environment. Detections, activities, and responses can be seen at this page. Insights include the following:
The Alerts queue provides a list of all alerts that are active in your environment. Any activity that is flagged from any onboarded device will generate an alert. Alerts are assigned severity as follows:
Alerts can be integrated with Automated investigations to allow for supported entities (such as a file) to automatically be submitted for an automatic investigation. This greatly reduces the need to manually review each alert that comes in. When viewing alerts you are provided several pieces of data including Alert title, Severity, Incident, Status, Category, Device, user, and more. You can also filter alerts by topics such as Severity, Threat, OS Platform, State, and more.

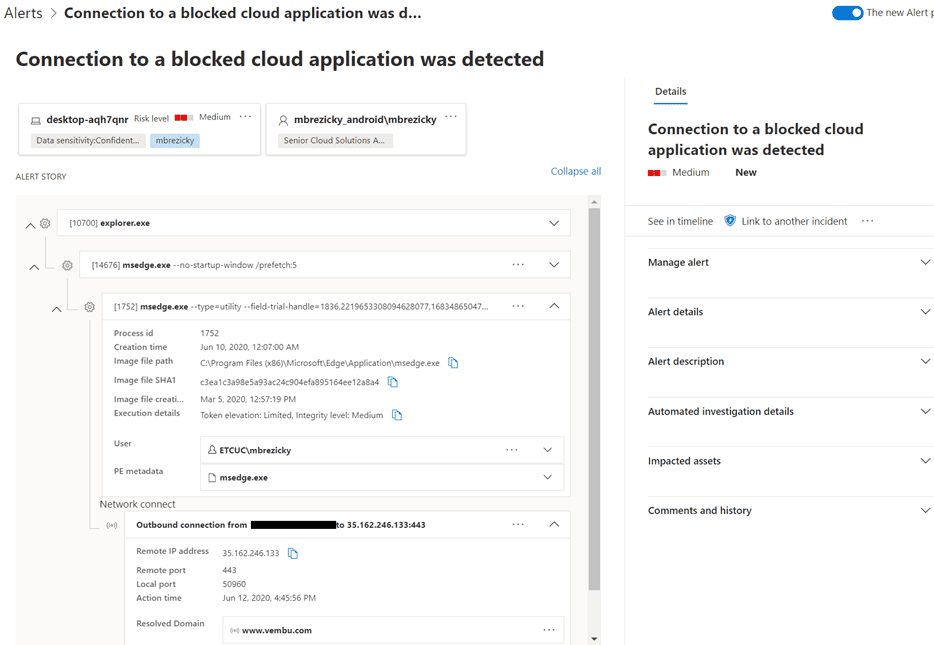
When reviewing a specific alert, you can click further into the event and see very specific details related to the file or event that occurred. There are typically two panes in the alert details, story and details. The story pane shows all the entities associated with the event in a tree view. The details pain shows a significant amount of details related to the event. Details available differ based on the Alert. You can act on the alert right from the details pane including setting status and classification, linking to an incident, or creating a suppression rule.
The Incidents queue provides an aggregate view of individually related alerts. This helps consolidate alerts and events to prioritize what your time and response should be given to. Incident queue works much like the Alerts queue with similar severities and management capabilities.
Incidents are created automatically based on alert activities. Alerts can also be manually added to an incident if not automatically flagged. Incidents are named based on the commonality of alerts that are grouped together such as alert title or users/devices affected.

When viewing an incident, you can see all the alerts associated with the incident. You can still click on each alert to see individual details; however, in addition you are also provided additional categories of information. You can view all devices, automated investigations, Evidence (entities such as files, processes, or services), as well as a visualized graphical view.

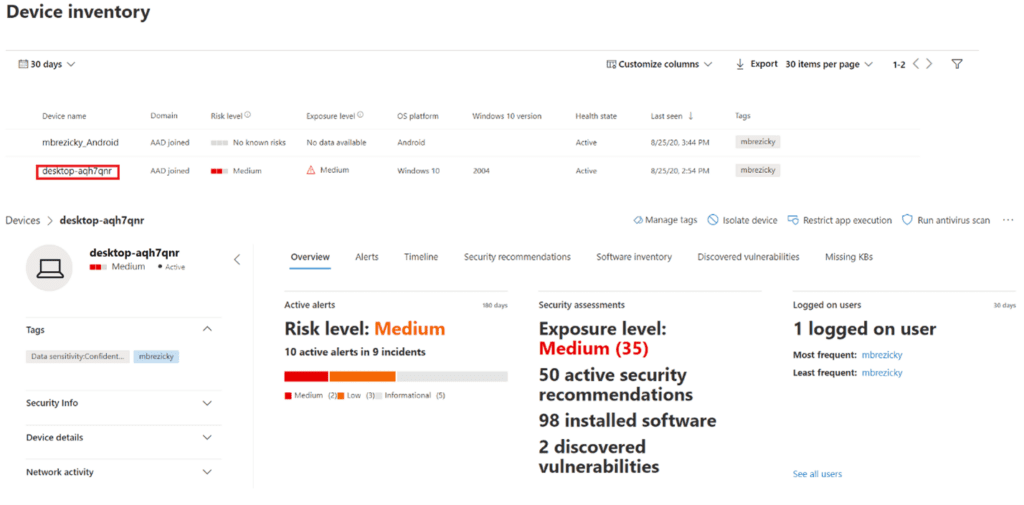
The Device Inventory provides a list view of devices onboarded to MDE service. From this list you can get a quick view of devices at greatest risk or exposure.
Selecting a device allows for greater details and potential actions. You can view current security info and device details. In addition, you can see current risk level, associated alerts, timeline, security recommendations, software inventory, and vulnerabilities. The timeline tab provides an extremely granular event mapping that can be incredibly useful in pinpointing root causes of an attack.
EDR Response Actions
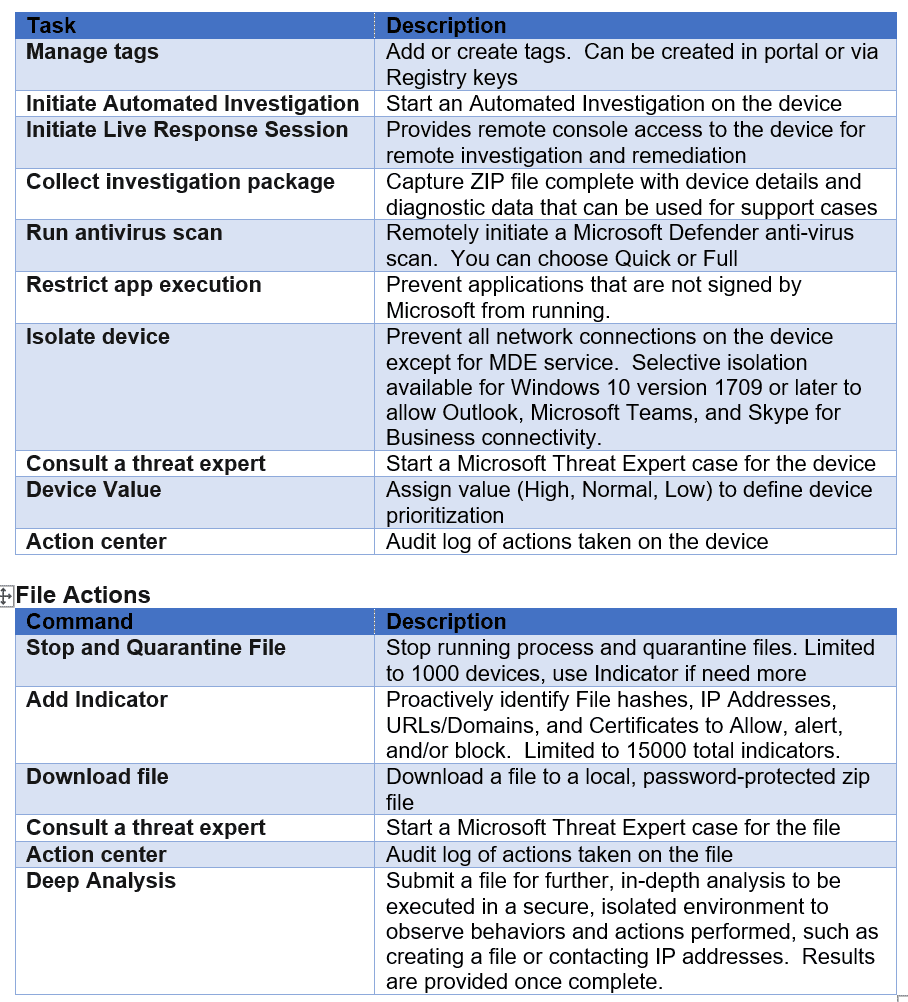
Once you have sufficient forensic evidence of a threat, you can act within MDE portal. The type of action you can take depends on whether the malicious object or activity occurred on a device or within a file. The following shows each task that can be taken on a device and file:
Summary
MDE EDR capabilities provide a significant oversight and management capabilities to activities occurring within your environment and devices. Whether using Microsoft Defender as your primary anti-virus solution or a 3rd party, onboarding to MDE to enable the EDR module will provide security teams the enterprise grade solution they may need to help alleviate threats and expedite forensic investigation and remediation activities.
Work with our team of Cloud Computing Consultants with years of experience that know all of the “minefields” to prevent missteps.